Street Life, Measured at Eye Level

Today we dive into Measuring Human-Scale Urbanism: Tools for Evaluating Street Experience, translating eye-level observations into actionable evidence. We’ll blend counts, conversations, sensors, and sketches to understand how streets protect, comfort, and delight, then turn findings into small wins that invite people to linger, smile, and return.

What Matters When You Walk
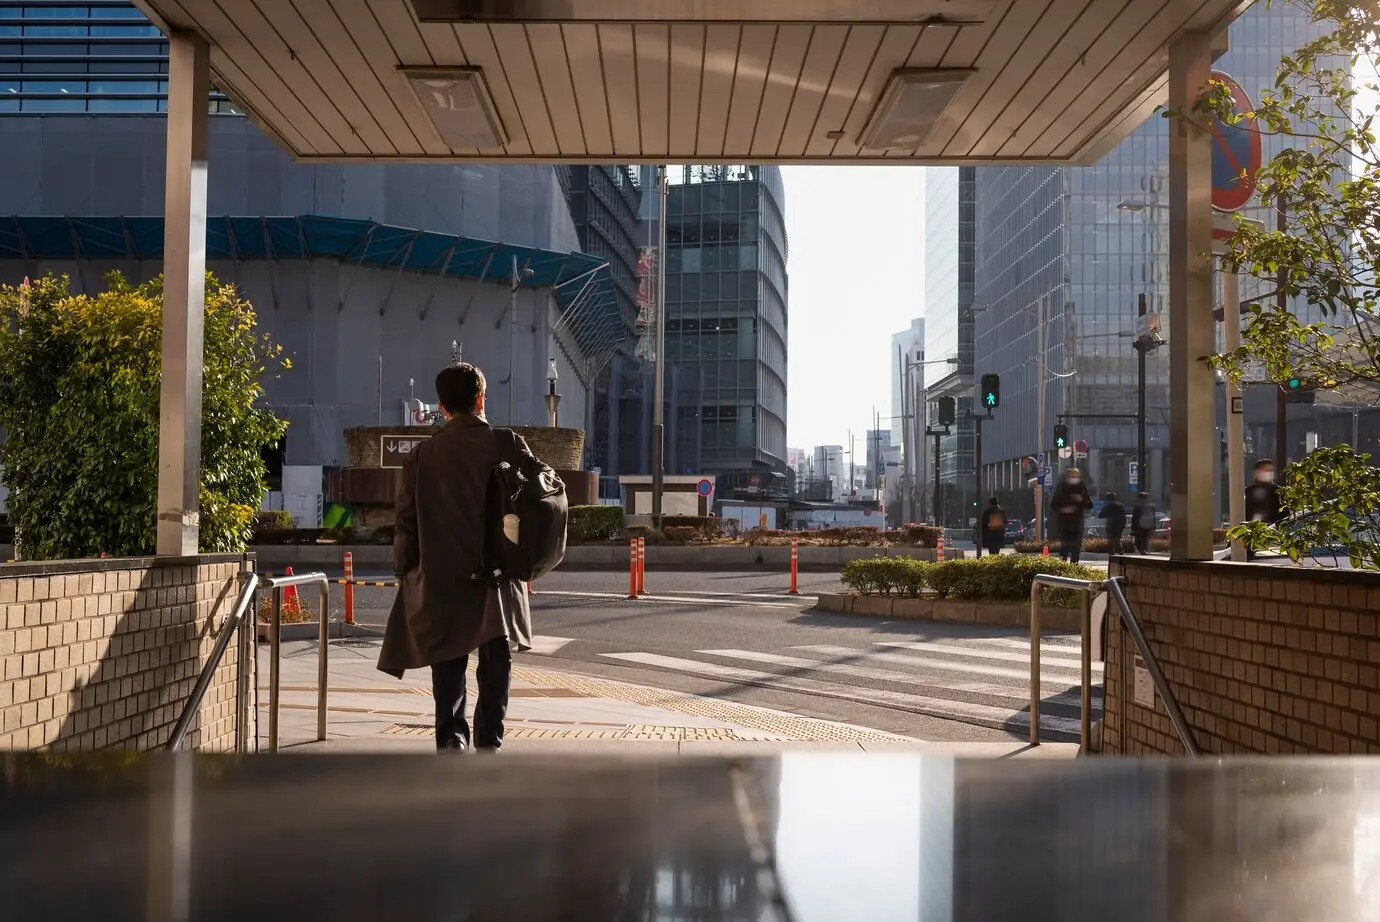
Great streets work at five kilometers per hour, where faces, textures, and little courtesies matter most. We unpack protection from traffic, places to rest, and moments of joy, translating fuzzy impressions into shared measures that teams can test, compare, and improve without losing the nuance of everyday life.

Counts With Context

Counts are more meaningful when paired with context. Note direction, group size, age cues, mobility aids, and activities like eating or chatting. If using computer vision, audit samples for bias. Record weather and special events, so trends reflect street design rather than anomalies.

Shadowing the Journey

Walk beside people for five minutes and listen. Ask what surprised, annoyed, or delighted them. Map micro-stumbles, pinch points, and moments of relief. These narratives ground numbers, helping coalitions argue for simple fixes like shade at bus stops or a shelf near ticket machines.

Tracing Paths and Pauses

Phones, beacons, or simple stickers can trace paths and pauses when consent is clear. Combine trajectories with dwell-time spots to see where space invites lingering. Validate with observations, ensuring insights guide placement of seating, vendors, trees, and art rather than just optimizing commutes.

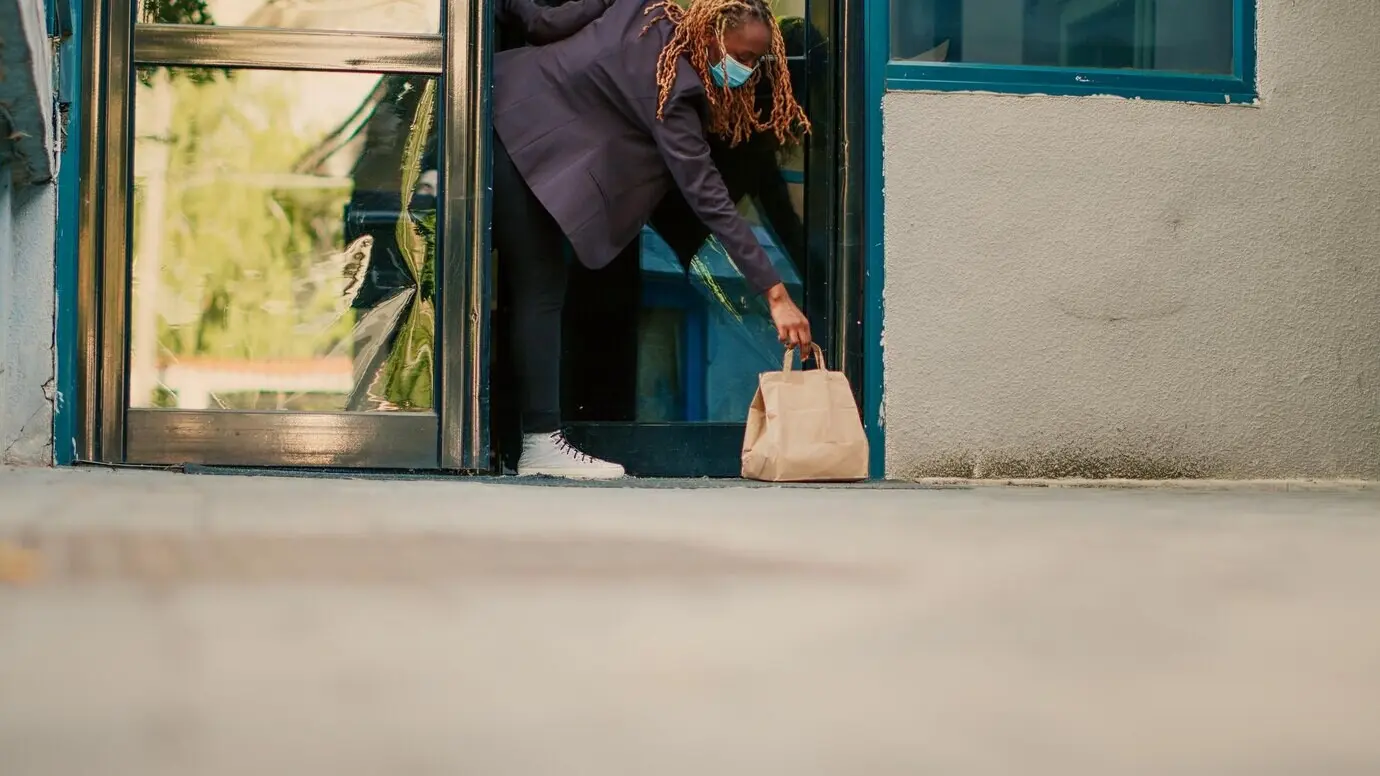
Inclusion Starts With the Slowest User
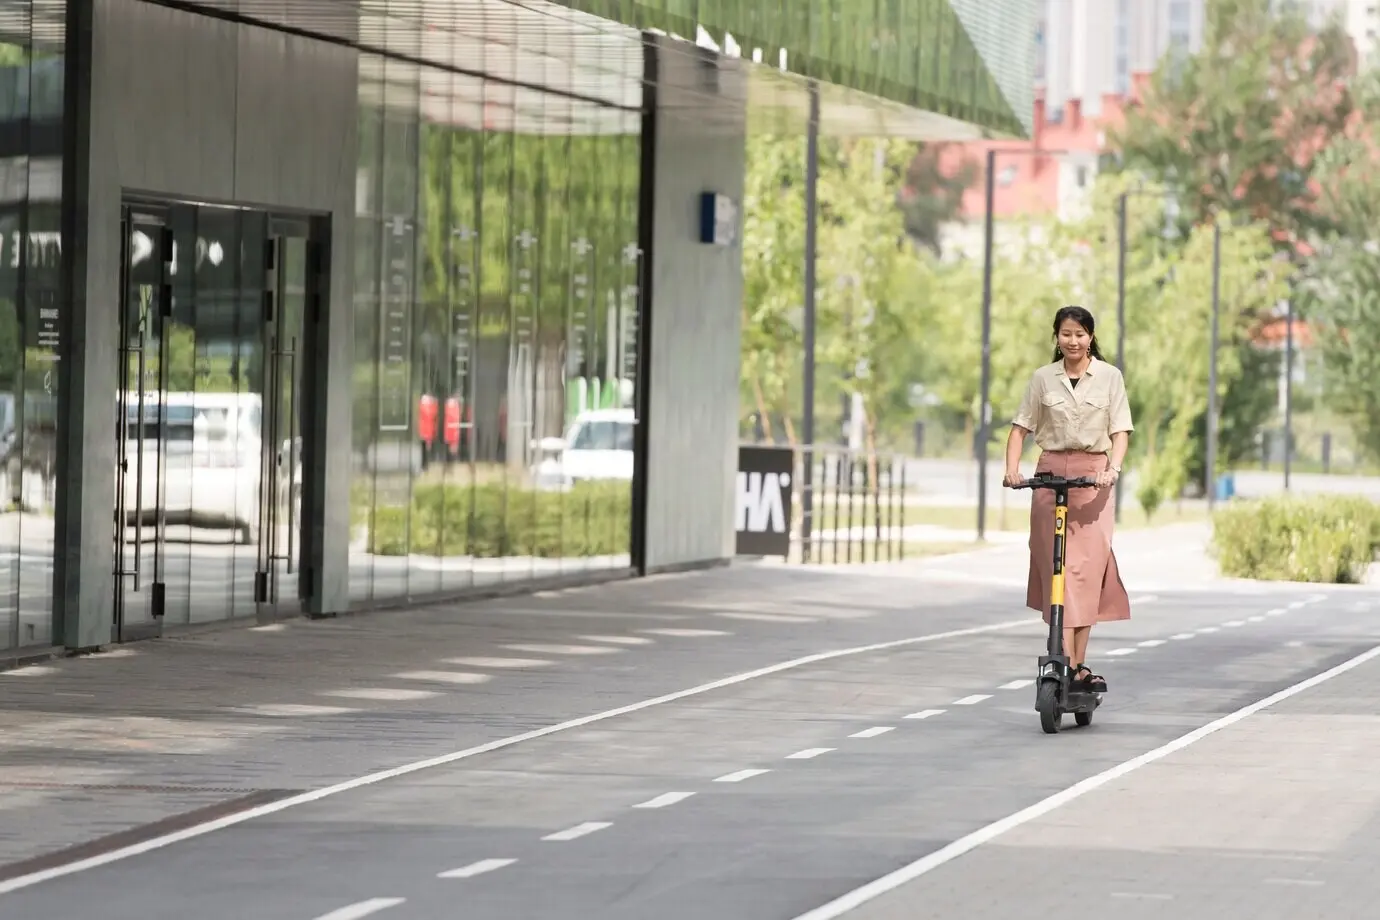
Streets succeed when a child, an elder, and a wheelchair user can move confidently side by side. We measure gradients, gaps, signals, and social cues, noticing where designs exclude. Inclusion emerges from details that respect different bodies, senses, cultures, and the rhythms of everyday caretaking.

Rolling the Route

Try a roll-along audit with local users. Measure cross slopes, surface joints, ramp alignments, and driveway intrusions. Note temporary obstacles like sandwich boards. Time how long it takes to traverse a block. These experiences reveal friction the drawing set forgot to mention.

Signals You Can Hear, Curbs You Can Feel

People who cannot see traffic need cues they can trust. Check tactile paving patterns, consistency at corners, audible timings, and locator tones. Record whether crossings align straight, and if refuge islands actually protect. Inclusive signals reduce hesitation and unlock independent movement for many neighbors.

Safety, Comfort, and Belonging After Dark

Comfort is social as much as spatial. Audit lighting color, shop openings, and sightlines, then survey perceptions of safety by gender, age, and ethnicity. Note whether stewards, vendors, or bustling facades create watchful presence. Small changes can shift night into welcome rather than worry.

Mapping Shade and Heat You Actually Feel

Map shade hourly, especially during hot months. Use simple thermometers and infrared readings to compare surfaces people touch. Apply human-centric indices like UTCI to communicate comfort clearly. These data justify trees, awnings, and lighter pavements, ensuring delight does not vanish when summer arrives.

Wind, Corners, and Places to Pause

Wind can amplify cold or refresh heat. Note corner accelerations, sidewalk tunnels, and sheltered niches near doors. Pair on-site flags with seasonal measurements. Place seats with backs to breezes and faces to sun, so people choose to linger instead of bracing through.

Materials That Welcome Bare Hands and Resting Backs

Textures carry temperature. Touch railings, benches, and paving at midday and evening. Track glare that narrows eyes and discourages conversation. Favor wood, composites, and shaded metals where possible. Materials that respect human skin quietly expand invitations to pause, lean, eat, and talk.

Vitality You Can Count Without Killing the Magic

Vibrant streets feel spontaneous yet are often supported by precise adjustments. We measure dwell time, seating occupancy, invitations to enter, and rhythms of daily life. The goal is not surveillance, but to learn which small moves unlock neighborliness and viable local business.

Dwell Time and the Bench Test

Time how long people comfortably sit, and what prompts them to stay longer: shade, music, friendly staff, or a view of kids playing. Test movable chairs. When dwell time rises during boring hours, you likely improved the place rather than entertained briefly.

Permeable Edges and Invitations to Enter

Transparent glass, frequent doors, and sociable thresholds boost curiosity. Measure the percentage of active frontage, note display height, and track how often people peek inside. Small design tweaks convert spectators into customers, keeping money local and energy visible on the sidewalk.

Temporal Patterns That Bring Streets Alive

Observe mornings, lunches, school release, sunsets, and late evenings. Some blocks blossom with street food or prayer times; others with buskers or dog meetups. Schedule observations across days and seasons, so decisions respect recurring patterns rather than a single photogenic afternoon.

From Near Misses to Safer Moves

Safety is not only the absence of crashes; it is confidence to move freely. We analyze near misses, speed behavior, visibility, and turning radii, then redesign edges that forgive mistakes. Measuring precursors shortens the distance from evidence to action and lasting change.

Seeing Risks Before Crashes Happen

Conflict studies reveal risky choreography at intersections and driveways. Use temporary cameras with strict privacy guards, or trained observers, to log yielding, hesitation, and evasive maneuvers. Target fixes where patterns cluster, then remeasure to confirm fewer close calls and calmer movement.

Designing for Forgiveness, Measuring for Proof

Design for error using tighter turning speeds, visible crossings, and forgiving edges. Track yielding rates, pedestrian delay, and post-implementation behavior. Safe system logic turns blame into responsibility shared by street geometry, ensuring everyday mistakes no longer produce life-altering consequences.

Speed You Set With Space, Not Signs

Signs beg; shapes decide. Narrow lanes, raised crossings, and gentle curves set expectations your body obeys. Measure 85th-percentile speeds before and after changes, and note whether families appear. When movement slows naturally, other metrics—vitality, sales, happiness—quietly rise.

Ethics, Storytelling, and Getting It Built

Data about people in public space deserve care. We commit to consent, minimization, and transparency, and we tell stories that humanize numbers. Most importantly, we close loops by prototyping small improvements quickly, inviting neighbors back to test whether the place truly feels better.
Xufefupevaxoxevifepe
Privacy Overview

This website uses cookies so that we can provide you with the best user experience possible. Cookie information is stored in your browser and performs functions such as recognising you when you return to our website and helping our team to understand which sections of the website you find most interesting and useful.